Agent operations · Analysis
AI agent observability: traces, metrics, and evidence
AI agent observability turns each run into linked traces, metrics, and protected evidence. Learn what to capture, alert on, retain, and review.
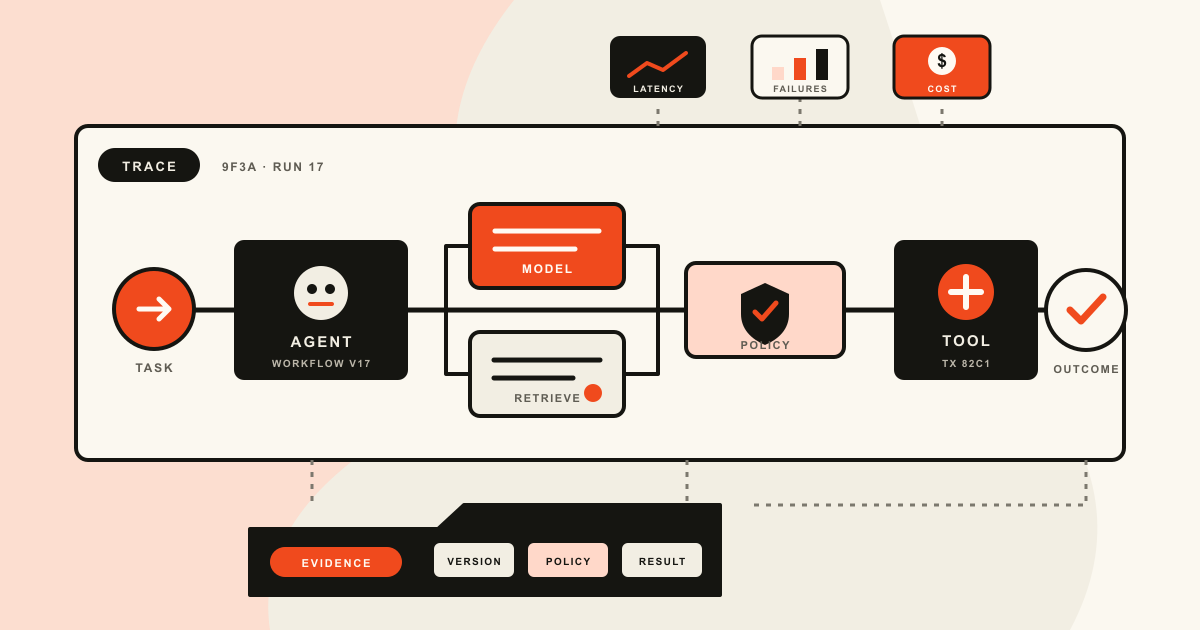
AI agent observability is the ability to reconstruct an agent run and measure its production behavior. Give each user task one end-to-end trace, then add child spans for model calls, retrieval, tools, handoffs, policy checks, approvals, and side effects. Derive low-cardinality metrics for reliability, latency, cost, and outcomes from those events. Keep a protected evidence packet with release versions, source references, policy decisions, transaction IDs, and later human or business feedback. Traces explain individual runs, metrics reveal population-level change, and evidence supports incident review. None of them alone proves that an answer or action was correct.
AI agent observability is the ability to explain a run after the agent has crossed model, tool, data, policy, and service boundaries. A normal application trace can show that an HTTP request returned 200 in 4.2 seconds. That does not say whether the agent used the right customer record, retried a payment, ignored a policy denial, or gave up before completing the task.
A status code leaves out the semantic record. Operators need to know which task the agent was attempting, which version was active, what external facts it used, which actions it proposed, what controls ran, and what happened in the business system. That calls for traces, metrics, and durable evidence rather than a transcript viewer with token totals.
The three layers answer different questions. A trace reconstructs one run. Metrics show whether a population of runs has changed. An evidence packet preserves the facts needed to review a consequential outcome. Logs and events add detail to any of those layers. If the layers share identifiers and a stable event vocabulary, an alert can lead to a representative trace and then to the exact policy decision or downstream transaction that matters.
What agent observability must explain
Start with the task, not the model request. One user task may trigger several model calls, a retrieval step, two tools, an approval pause, a queue, and a handoff to another agent. Treating each model call as an independent root trace breaks the causal chain that an investigator needs.
A useful model has four connected records:
| Record | Purpose | Typical contents |
|---|---|---|
| Run | Identifies one attempt to satisfy an external task | trace ID, task type, workflow version, start and end state, release cohort |
| Span or event | Records one bounded operation or state transition | parent span, operation type, component version, timing, outcome, error class |
| Metric | Aggregates repeated observations with controlled dimensions | completion rate, duration distribution, retries, tool failures, token use |
| Evidence packet | Preserves reviewable facts about a material result | source IDs, policy record, approval, tool arguments or digest, transaction ID, feedback |
The run needs an explicit terminal state. completed, failed, cancelled, timed_out, denied, awaiting_human, and unknown_after_side_effect are more useful than a Boolean success field. A workflow can produce a fluent final message while the requested operation failed. It can also complete correctly after a tool returned an error that the agent handled. Transport status and task status belong in separate fields.
Define the task outcome before building dashboards. For a support agent, success might require a correct answer grounded in the current policy and no unauthorized account change. For an order agent, it might require one accepted order with a matching confirmation ID. The AI agent ecosystem map places evaluation and observability around the whole runtime for this reason. Model output is only one part of the system being observed.
Do not make hidden chain-of-thought text a dependency. An observability record should capture observable inputs, selected actions, structured plans when the application exposes them, tool results, control decisions, and outcomes. Private model reasoning is neither a stable API nor reliable forensic evidence. The useful question is what the system received and did, not whether a generated explanation sounds plausible afterward.
Trace the complete agent run
The root trace should begin when the application accepts responsibility for a task and end only when the task reaches a known state. A streaming response can finish before a background action settles. A human approval may suspend the task for hours. A queue may move it into another process. The trace model has to follow those boundaries or link the resulting traces with an operation ID that survives the pause.
Inside the run, create spans for operations that can fail, wait, change cost, alter state, or cross a trust boundary. A practical span tree might look like this:
refund_request [root task]
  invoke_agent [workflow version 17]
    retrieve_policy [policy revision 2026-07-18]
    model_call [requested and resolved model]
    propose_tool [refund_order]
    policy_check [require_approval]
  human_approval [approved amount and actor]
  execute_tool [refund_order]
    payment_api [transaction rf_82...]
  final_response [confirmation returned]
This hierarchy reveals timing and causality without storing every payload. It also separates a proposed call from an executed call. That distinction matters when a guardrail, policy engine, or reviewer blocks the proposal.
Record these operations when they exist:
- agent and workflow invocation;
- model generation, including the requested model and the resolved response model;
- retrieval, with the data source and returned document identifiers;
- planning or decomposition that the application exposes as structured state;
- tool proposal, validation, policy decision, approval, execution, and result;
- guardrail checks and their bounded result codes;
- handoffs between agents, services, or people;
- checkpoint save, resume, retry, compensation, and cancellation;
- external side effects with an idempotency key and downstream transaction ID.
The current OpenTelemetry GenAI agent conventions define operations such as invoke_agent, invoke_workflow, plan, retrieval, and execute_tool. That vocabulary is a strong starting point, but it does not remove the need for domain spans. An insurance workflow may still need coverage_decision; a commerce workflow may need reserve_inventory. Use low-cardinality operation names, then keep unique record IDs as trace attributes rather than inventing a span name per order or user.
Trace context must cross ordinary infrastructure too. The W3C Trace Context specification standardizes traceparent and tracestate so different services and tracing systems can correlate work. Propagate context through HTTP, RPC, messaging, and job metadata. For deferred work, store the parent reference and a durable operation ID with the checkpoint. Do not put email addresses, tenant names, or other personal data in trace context headers. The W3C specification reserves them for correlation and explicitly forbids personally identifiable information there.
Keep identifiers separate by meaning:
| Identifier | Scope |
|---|---|
trace_id |
One bounded execution attempt |
task_id or operation_id |
The business task across retries, pauses, and linked traces |
conversation_id |
A thread that may contain several tasks |
tool_call_id |
One proposed or executed tool invocation |
transaction_id |
The authoritative downstream side effect |
One generic session_id cannot answer all five questions. Reusing a conversation ID as a trace ID also creates very long traces that are hard to sample, retain, and investigate.
Metrics that reveal change
Metrics should be derived from a stable run and span vocabulary. Counting ad hoc log messages produces a dashboard that changes whenever a developer edits text. Structured terminal states and operation types give every ratio a clear numerator and denominator.
Begin with task reliability:
- completion rate by task type and release cohort;
- failure, timeout, cancellation, and unknown-outcome rates;
- retries per task and repeated side effects prevented by idempotency;
- tool validation failures, policy denials, and approval escalations;
- handoff loops, maximum-step stops, and abandoned approval waits.
Then measure performance at the task and component levels. Use distributions, not averages alone. End-to-end task duration, queue time, approval wait, model operation duration, retrieval duration, and tool duration reveal different bottlenecks. The development-status OpenTelemetry GenAI metrics distinguish client operation duration from workflow duration and define token, first-chunk, agent-invocation, and tool-call instruments. That separation prevents a fast model response from hiding a slow or stuck workflow.
Cost metrics need the same boundaries. Record input and output tokens when the provider reports them, cache reads and writes where available, model and provider, tool or retrieval charges, and the number of calls per completed task. cost per run is useful for capacity planning. cost per successful outcome is better for product decisions because a cheap failed run has produced no value.
Outcome metrics should come from the system that owns the outcome. A payment service knows whether a refund settled. A support system knows whether the ticket reopened. A reviewer can label whether cited evidence supported an answer. Attach those facts to the task later rather than asking the model to grade its own success at the end of the run.
Metrics also need controlled dimensions. Task type, workflow version, model family, release cohort, outcome class, tool name, and error class are usually manageable. User ID, prompt text, trace ID, document ID, and raw error messages are high cardinality and belong in traces or logs. Putting them into metric labels increases cost and can make aggregation unreliable.
An alert should state an operational hypothesis. For example: completion rate for refund_request fell below its service objective in release cohort 17, while policy denials remained steady and tool timeouts increased. The alert can link to failed and successful traces from the same cohort. An alert that says only "agent quality is low" gives the responder nowhere to start.
Build an evidence packet
A trace is optimized for navigation and timing. A material action may need a smaller, durable record that survives trace sampling, backend migration, and normal retention. That record is the evidence packet.
The packet should make the final outcome independently reviewable. For a consequential tool call, preserve:
- the task, trace, tool-call, and downstream transaction identifiers;
- timestamps and the initiating principal or privacy-safe subject reference;
- agent, workflow, prompt-template, model, tool-schema, policy, and retrieval-index versions;
- source document identifiers, revisions, and relevant content digests;
- the normalized action or a protected digest, plus validation results;
- the policy decision, rule version, approval requirement, and approving actor;
- idempotency and retry records, including ambiguous transport outcomes;
- the authoritative business result and any later correction, appeal, or human label;
- redaction, sampling, retention, and access classification applied to the record.
The packet does not have to duplicate a complete transcript. Often it should not. A document ID and immutable revision can be safer and more useful than a copied private document. A normalized amount, currency, beneficiary ID, and transaction reference may be enough to review a payment without retaining unrelated conversation history.
Evidence also needs provenance. Mark fields as observed, computed, human supplied, or model supplied. A model-generated reason field is an output, not proof of why the model acted. A policy engine's signed decision record and the payment API's transaction response have different evidentiary weight. Keeping those origins visible prevents a polished model explanation from overwriting stronger system facts.
The same principle appears in the MCP security architecture guide: a useful audit trail connects the initiating principal, approved tool and arguments, policy result, downstream identity, and final side effect. Agent observability broadens that chain to include the model, retrieval, handoffs, task outcome, and population metrics.
Protect evidence integrity. Restrict who can update outcome labels, retain an edit history, and separate the original event from later annotations. If an incident reviewer changes the root-cause category, the old category should remain discoverable. Otherwise the observability system can quietly rewrite the history it is meant to preserve.
Connect observability to evaluation
Observability describes what happened in production. Evaluation judges behavior against a task, rubric, policy, or expected outcome. They should exchange data, but they are not interchangeable.
A trace can prove that the agent retrieved document revision 14 and called create_refund once. It cannot, by itself, prove that revision 14 supported the answer or that the refund was appropriate. An evaluator can score groundedness or policy compliance, but its score is another measured result. Record the evaluator, version, rubric, input scope, score, label, and time so the judgment can be reproduced or challenged.
Use production traces to find evaluation cases. Select incidents, low-confidence outcomes, policy denials, unusual tool sequences, high-latency runs, and corrected answers after privacy review. Turn recurring failures into regression cases. Then attach evaluation results back to production cohorts to see whether a release improved the cases that matter.
Do not alert on an evaluator score until its operating characteristics are known. Track disagreement with expert reviewers, missing-score rate, score distribution by task type, and changes after an evaluator update. Mixing scores from two evaluator versions in one time series can look like product drift even when only the judge changed.
NIST's AI Risk Management Framework Core separates continuous production monitoring from documented measurement and risk management. It calls for production behavior monitoring, feedback and appeal mechanisms, incident response, recovery, and change management. That is a wider loop than trace collection, and it is a useful test of whether an observability program can support decisions rather than merely display activity.
Sampling, privacy, and retention
Agent traces are expensive because payloads can be large and runs can contain many spans. They are also sensitive. Prompts, retrieved passages, tool arguments, account data, policy results, and model outputs can turn the telemetry store into a second copy of production data.
Collect metadata by default and content by explicit policy. Model, operation, version, timing, token counts, result class, document IDs, and payload digests are often enough for routine monitoring. Raw messages, system instructions, tool arguments, tool results, and retrieved text need field-level rules based on task and data class.
The OpenTelemetry GenAI conventions mark input messages, output messages, prompt variables, and system instructions as opt-in or potentially sensitive. The OpenAI Agents SDK tracing documentation provides a concrete warning: generation and function spans may store model and tool inputs and outputs, and the SDK exposes controls for disabling sensitive trace data. Check framework defaults rather than assuming that content capture is off.
Apply filtering close to the source. The OpenTelemetry guidance on handling sensitive data describes data minimization and Collector processors that can remove attributes, filter records, hash fields, or transform values. Prefer an allowlist for sensitive workloads. A denylist of words such as password will miss domain-specific identifiers and secrets embedded inside free text.
Sampling policy should preserve investigation value:
- keep all runs with errors, policy denials, guardrail trips, human escalations, or unknown side-effect outcomes;
- keep all high-impact actions, or at least their evidence packets, regardless of trace sampling;
- retain a representative sample of ordinary successful runs by task type and release cohort;
- increase sampling for new releases, rare workflows, and detected anomalies;
- make the decision late enough to see the outcome when the tracing stack supports tail sampling.
Do not blindly honor a sampling flag from an untrusted caller. W3C Trace Context treats the sampled flag as a recommendation and documents abuse risks, including forced tracing overhead and higher vendor bills. Apply local limits and policy at public boundaries.
Set retention by purpose. Aggregated metrics can often remain longer than detailed traces. Evidence for regulated or consequential actions may need a defined business or legal schedule. Raw content should usually have the shortest justified lifetime. Record deletion and legal-hold behavior, restrict access by role, audit access to sensitive traces, and test that backups follow the same lifecycle.
Use standards without freezing the schema
OpenTelemetry defines traces, metrics, logs, and baggage as distinct signals that can be correlated. Its GenAI repository adds semantic conventions for model calls, agents, tools, workflows, evaluation events, and MCP. W3C Trace Context carries correlation across vendor and service boundaries. Together they provide a practical base for portable telemetry.
The GenAI semantic conventions still have Development status. Names, requirement levels, and signal placement can change. Pin the convention version used by each instrumentation library, keep a small internal schema registry, and translate framework-specific events at the collection boundary. Store both the original event version and the normalized version so a migration does not erase meaning.
Automatic instrumentation is a starting point. It can capture model calls and supported framework operations, but it cannot infer the business task, authoritative outcome, approval semantics, data classification, or downstream transaction. Add those attributes in application code where the facts are known.
Portability also requires a framework-neutral task envelope. Define a root operation, terminal states, task and release identifiers, outcome classes, and evidence references that remain stable if the team changes model providers or agent frameworks. The agent RAG architecture guide uses the same idea for retrieval systems: control-loop transitions, source lineage, model versions, and final disposition matter more than one framework's callback names.
Baggage deserves restraint. It can propagate context between services, but it may also travel to unintended destinations and does not come with built-in integrity checks. Carry a random task correlation value where needed. Do not use baggage as a trusted source of tenant authorization, user identity, or policy decisions.
Choose a backend after the event model and operational questions are clear. Product features such as trace search, evaluation queues, cost views, self-hosting, access controls, and retention matter, but they belong in a separate tools comparison. The canonical design should survive a backend change.
A production rollout checklist
Roll out observability in the order needed to reconstruct risk. A large dashboard built before task states and identifiers are stable will hide gaps behind polished charts.
- Define the external task, terminal states, authoritative outcome, and material side effects.
- Give each attempt a root trace and each logical task a durable operation ID across retries and pauses.
- Instrument model, retrieval, tool, policy, approval, handoff, checkpoint, and downstream operations that exist in the workflow.
- Propagate trace context through services and queues, then test for broken parent-child links.
- Record release, model, prompt, tool-schema, policy, data-source, and workflow versions.
- Add content capture only after field-level data classification, redaction, access, and retention rules exist.
- Derive reliability, latency, cost, control, and outcome metrics from structured events with explicit denominators.
- Preserve evidence packets for material actions independently from normal trace sampling.
- Connect alerts to representative failed and successful traces from the same task type and cohort.
- Exercise timeouts, repeated tool calls, approval pauses, handoffs, lost responses after side effects, policy denials, and trace-backend outages.
- Verify that the agent can continue safely when telemetry export is slow or unavailable. Observability must not become an unbounded queue or a new path to duplicate an action.
- Review the schema when a framework, model, prompt, tool, policy, or business outcome changes.
A final incident drill exposes weak links quickly. Pick one completed task and ask an operator to identify the initiating request, active release, evidence used, model and tools called, policy and approval results, downstream side effect, final user response, and later outcome. Then ask for the cohort metrics around the same release. Any answer that requires searching unrelated systems by timestamp is a missing correlation or evidence field.
Useful observability keeps a bounded, protected account of what the system attempted, what it did, which controls applied, and what outcome followed. It does not need a copy of everything the agent saw. With that record, a team can debug one run, detect population change, investigate an incident, and decide whether the next release should proceed.
Sources and methodology
This article draws on the primary documentation and research listed below. An editor reviewed the technical claims and wording before publication.
- OpenTelemetry Signals — official definitions of traces, metrics, logs, and baggage as distinct telemetry signals
- OpenTelemetry GenAI Semantic Conventions — current development-status conventions for GenAI events, metrics, model spans, agent spans, and MCP
- OpenTelemetry GenAI Agent and Framework Spans — span definitions for agent invocation, workflows, planning, retrieval, and tool execution
- OpenTelemetry GenAI Metrics — metric definitions for tokens, model operations, workflows, agent invocations, and tool calls
- W3C Trace Context Level 2 — vendor-neutral trace context propagation, sampling flags, and privacy and security requirements
- OpenTelemetry Handling Sensitive Data — data minimization and Collector processors for filtering, hashing, redaction, and transformation
- OpenAI Agents SDK Tracing — a concrete agent runtime example covering traces, spans, tools, handoffs, guardrails, and sensitive payload controls
- NIST AI Risk Management Framework Core — production monitoring, documentation, incident response, feedback, override, and change-management outcomes